
Traditional budgeting is theatre. Finance teams spend months building annual budgets that are obsolete before the ink dries. When market conditions shift, the response is panic, guesswork, and spreadsheet gymnastics. Driver-based forecasting offers a fundamentally different approach: link financial outcomes to operational drivers, build dynamic models, and run scenarios in real-time. Here's how leading CFOs are doing it.
The Problem with Traditional Budgeting
The annual budgeting process is broken:
1. Time-Intensive and Slow
- Takes 3-6 months to complete
- Involves endless negotiation between finance and operations
- Locks resources in bureaucracy instead of value creation
2. Backward-Looking
- Based on last year's actuals, adjusted for growth assumptions
- Ignores structural changes in the business or market
- Assumes the future will resemble the past (rarely true)
3. Disconnected from Operations
- Finance builds budgets in isolation, then hands them to operations
- Operational managers don't understand the assumptions
- No clear link between operational levers and financial outcomes
4. Inflexible
- Once locked, budgets become rigid constraints
- No mechanism to update for changing market conditions
- Variance reports show "what happened" not "what to do"
5. Politically Motivated
- Managers sandbag targets to look good on performance reviews
- Finance inflates assumptions to placate investors
- Truth gets lost in negotiation
Result: Budgets that are inaccurate, unusable, and detached from reality.

What Is Driver-Based Forecasting?
Driver-based forecasting reverses the logic of traditional budgeting:
Traditional approach: "Revenue will be £50M next year because we grew 10% this year."
Driver-based approach: "Revenue = (Number of Customers) × (Average Order Value) × (Purchase Frequency). Let's model each driver based on operational plans and market assumptions."
Core Principles
1. Identify Operational Drivers
Break down financial outcomes (revenue, costs, cash flow) into operational drivers—the activities, volumes, and rates that determine results.
Example (Manufacturing):
- Revenue = Units Sold × Average Selling Price
- Units Sold = Production Volume × (1 – Scrap Rate) – Inventory Change
- Production Volume = Machine Hours × Units per Hour × OEE
2. Build Causal Relationships
Link drivers to outcomes through formulas, not guesses. If machine hours increase 10%, production increases 10% (assuming constant efficiency).
3. Use Rolling Forecasts
Replace annual budgets with continuous forecasting. Update forecasts monthly or quarterly based on actual performance and changing assumptions.
4. Enable Scenario Planning
Model multiple futures (base case, upside, downside). Adjust drivers to see impact on P&L, balance sheet, and cash flow in real-time.

Driver-Based Model Architecture
Layer 1: Operational Drivers (The Foundation)
These are the inputs you can measure, manage, and forecast:
| Business Area | Key Drivers |
|---|---|
| Sales | Customer count, conversion rate, average order value, churn rate, sales cycle length |
| Production | Machine hours, throughput rate, OEE, scrap rate, labour hours per unit |
| Procurement | Material usage per unit, supplier lead times, commodity prices, inventory turns |
| Workforce | Headcount by role, utilisation rate, overtime %, turnover rate, hiring pipeline |
| Capex | Growth projects, replacement cycles, capacity utilisation, ROI hurdle rates |
Layer 2: Financial Translation (The Bridge)
Convert operational drivers into financial metrics using formulas:
Revenue Formula:
- Revenue = (New Customers + Existing Customers) × Average Order Value × Purchase Frequency
- New Customers = Marketing Spend ÷ Cost per Acquisition × Conversion Rate
- Existing Customers = Last Period Customers × (1 – Churn Rate) + Reactivated Customers
COGS Formula (Manufacturing):
- COGS = (Material Cost per Unit + Labour Cost per Unit + Overhead Allocation) × Units Sold
- Material Cost per Unit = Raw Material Price × Usage Rate × (1 + Scrap Rate)
- Labour Cost per Unit = (Direct Labour Hours per Unit × Hourly Wage) ÷ Efficiency Rate
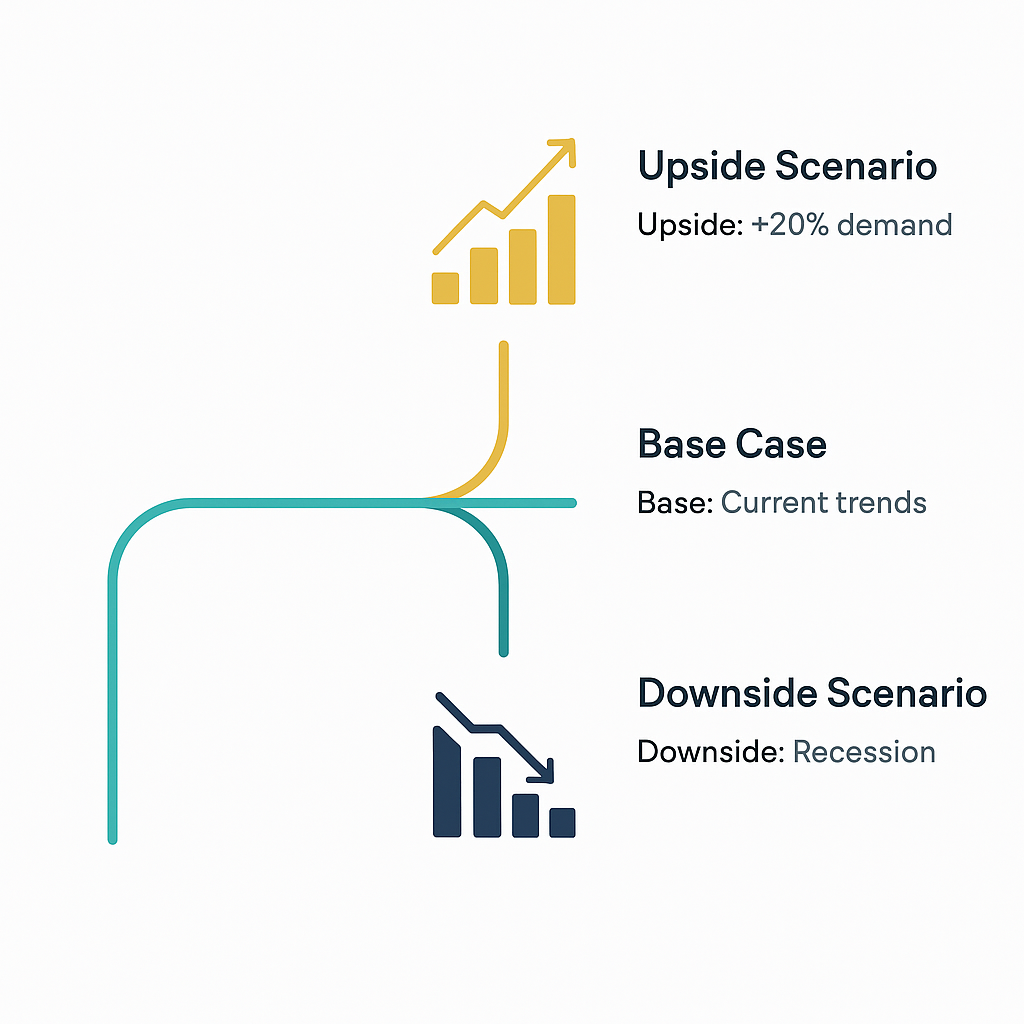
Layer 3: Scenarios and Sensitivities (The Decision Layer)
Model multiple futures by adjusting driver assumptions:
- Base Case: Most likely scenario based on current trends
- Upside: Optimistic scenario (e.g., +20% demand, +5% pricing power)
- Downside: Pessimistic scenario (e.g., recession, supply chain disruption)

Real-World Example: SaaS Business
Traditional Budget Approach
Finance projects £5M ARR next year based on "historical growth of 25%." No detail on how to achieve it.
Driver-Based Approach
Revenue Drivers:
- Monthly Recurring Revenue (MRR) = (New MRR + Expansion MRR) – (Churned MRR + Contraction MRR)
- New MRR = New Customers × Average Contract Value (ACV)
- New Customers = Sales Pipeline × Close Rate
- Sales Pipeline = Marketing Qualified Leads (MQLs) × MQL-to-SQL Conversion Rate
- Expansion MRR = Existing Customers × Upsell Rate × Average Upsell Value
- Churned MRR = Existing Customers × Churn Rate × ACV
Cost Drivers:
- Sales & Marketing: Cost per Lead × Lead Volume + Sales Headcount × Avg Salary
- Engineering: Developer Headcount × Avg Salary + Cloud Hosting (% of Revenue)
- Customer Success: CS Headcount × Avg Salary (driver: 1 CS rep per 50 customers)
Model in Action:
CFO adjusts assumptions in real-time:
- Scenario 1 (Base): MQL volume = 500/month, Close Rate = 15%, Churn = 5%/year → ARR = £4.8M
- Scenario 2 (Aggressive Growth): Increase marketing spend 30%, MQL → 650/month → ARR = £6.2M (but higher CAC, lower margins)
- Scenario 3 (Efficiency Focus): Improve Close Rate to 20% through better sales training → ARR = £5.5M (lower marketing spend, better margins)
Insight: Scenario 3 delivers better EBITDA and cash flow. Decision: Invest in sales enablement, not just lead volume.
Building a Driver-Based Model: Practical Steps
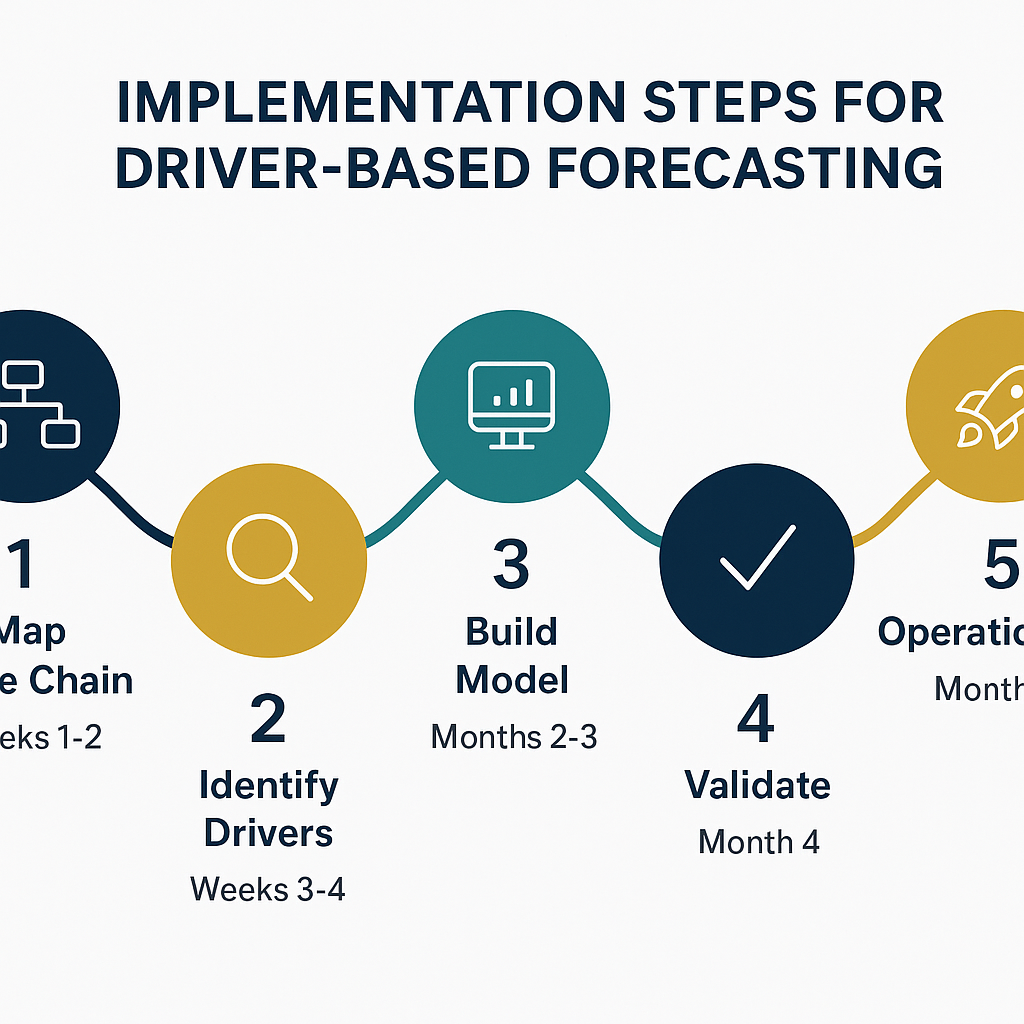
Step 1: Map the Value Chain (Weeks 1-2)
Identify how value flows through the business:
- Marketing generates leads
- Sales converts leads to customers
- Operations delivers product/service
- Finance collects revenue and manages costs
For each stage, list the key operational metrics.
Step 2: Identify Critical Drivers (Weeks 3-4)
Not all drivers matter equally. Use Pareto analysis:
- Which drivers explain 80% of revenue variance?
- Which drivers are manageable (can be influenced by decisions)?
- Which drivers have reliable data?
Typical Critical Drivers (Manufacturing):
- Production volume (machine utilisation × OEE)
- Average selling price
- Material cost per unit
- Direct labour hours per unit
Step 3: Build the Model (Months 2-3)
Option A: Excel/Google Sheets (Low Cost, High Flexibility)
- Create driver input sheet (assumptions)
- Build calculation engine (formulas linking drivers to financials)
- Output sheets: P&L, balance sheet, cash flow by scenario
- Pros: Familiar, flexible, no licensing costs
- Cons: Manual updates, version control issues, limited scalability
Option B: FP&A Software (Anaplan, Adaptive Insights, Planful)
- Cloud-based platforms with built-in modelling, scenario management, collaboration
- Pros: Scalable, auditable, integrates with ERP/CRM
- Cons: Expensive (£20k-100k/year), implementation complexity
Option C: Custom Build (Python, R, Power BI)
- Bespoke models using data science tools, machine learning for predictive drivers
- Pros: Unlimited flexibility, advanced analytics
- Cons: Requires technical expertise, maintenance burden
Step 4: Validate and Calibrate (Month 4)
Test the model against historical data:
- Run the model for last 12 months using actual driver values
- Compare modelled P&L to actual results
- Identify variances, refine formulas
- Goal: <5% variance between modelled and actual
Step 5: Operationalise (Month 5+)
Integrate into business rhythm:
- Monthly: Update actuals for key drivers, refresh forecast
- Quarterly: Revise assumptions based on market changes, run scenario analysis
- Ad hoc: Model impact of major decisions (pricing changes, capex investments, M&A)

Adding Machine Learning: Predictive Drivers
Advanced organisations use AI to forecast driver values, not just outcomes:
Use Cases
1. Demand Forecasting
- Train ML models on historical sales, seasonality, market trends, economic indicators
- Predict future unit volume by product line, customer segment, region
- Algorithms: ARIMA, Prophet, LSTM neural networks
2. Churn Prediction
- Predict which customers will churn based on usage patterns, support tickets, payment delays
- Model churn rate by cohort
- Algorithms: Logistic regression, random forests, XGBoost
3. Price Optimisation
- Model price elasticity: How does volume change with price?
- Optimise pricing to maximise revenue or margin
- Algorithms: Regression analysis, reinforcement learning
4. Cost Forecasting
- Predict commodity prices, energy costs, FX rates
- Use external data feeds (Bloomberg, FRED, weather APIs)
Reality Check: ML adds value when:
- You have large historical datasets (2+ years of granular data)
- Relationships are complex (non-linear, many variables)
- Accuracy improvement justifies investment (ML models require skilled data scientists, infrastructure)
For most SMEs, simple statistical methods (moving averages, linear regression) are sufficient.
Common Pitfalls and How to Avoid Them
1. Driver Overload
Mistake: Modelling 100+ drivers creates complexity without insight.
Fix: Focus on 10-20 critical drivers that explain 80%+ of variance.
2. Garbage In, Garbage Out
Mistake: Building sophisticated models on poor-quality data.
Fix: Invest in data infrastructure first. Ensure drivers are measurable, tracked consistently, and auditable.
3. Finance in a Silo
Mistake: Finance owns the model, operations doesn't understand or trust it.
Fix: Co-create with operational leaders. They should provide driver assumptions and validate outputs.
4. Over-Optimism Bias
Mistake: Base case becomes best case because managers inflate assumptions.
Fix: Use external benchmarks, historical performance, and independent validation. Force explicit downside scenarios.
5. Static Models
Mistake: Building a driver model once, then never updating it.
Fix: Embed into monthly/quarterly rhythms. Assign ownership (FP&A lead) and governance (quarterly model review).
Benefits of Driver-Based Forecasting
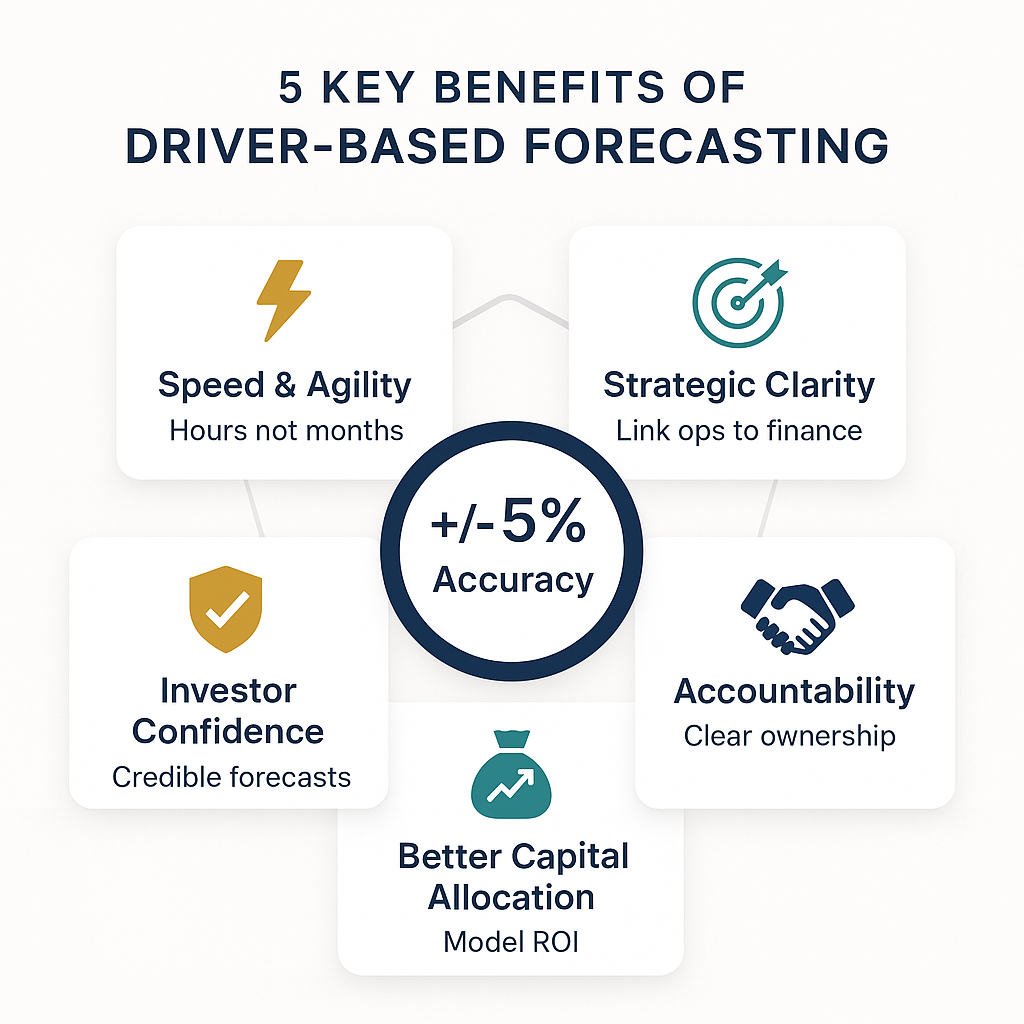
1. Speed and Agility
- Run new forecasts in hours, not months
- Test "what-if" scenarios in real-time
- Respond quickly to market changes
2. Strategic Clarity
- Link operational decisions to financial outcomes
- Understand trade-offs (e.g., revenue growth vs. margin)
- Prioritise investments based on ROI
3. Accountability
- Operational managers own driver targets, not just P&L outcomes
- Clear cause-and-effect: If you miss driver targets, you miss financial targets
4. Better Capital Allocation
- Model ROI of growth initiatives before committing capital
- Stress-test business plans under different scenarios
- Optimise cash flow and working capital
5. Investor Confidence
- Demonstrate rigour in financial planning
- Provide credible forecasts backed by operational data
- Show preparedness for downside scenarios
Case Study: Engineering Services Firm
Challenge: Revenue volatile, cash flow unpredictable, annual budgets obsolete within weeks.
Solution: Built driver-based model:
Revenue Drivers:
- Billable Hours = (Number of Consultants) × (Utilisation Rate) × (Working Days)
- Revenue = Billable Hours × Blended Hourly Rate
Cost Drivers:
- Staff Costs = Headcount × Average Salary × (1 + Employer NI + Pension)
- Overhead = Fixed Costs + (Variable Rate × Billable Hours)
Key Insight: Utilisation rate was critical driver. 5% increase in utilisation = £300k additional EBITDA.
Actions Taken:
- Implemented time-tracking system to monitor utilisation weekly
- Reallocated under-utilised consultants to active projects
- Adjusted hiring plan to match project pipeline (avoided over-hiring)
Results:
- Utilisation improved from 68% to 78%
- Revenue +£1.2M without adding headcount
- Forecast accuracy improved from ±20% variance to ±5%
- Cash flow predictability enabled earlier debt repayment
Conclusion: The Future of FP&A
Traditional budgeting is dead. The future belongs to organisations that:
- Link operations to finance through driver-based models
- Forecast continuously, not annually
- Run scenarios dynamically to test strategies before committing resources
- Leverage data and AI to predict driver values, not just outcomes
Driver-based forecasting isn't just a finance tool—it's a strategic capability. It transforms FP&A from backward-looking compliance to forward-looking decision support.
The companies that master this will allocate capital smarter, adapt faster, and outperform those still locked in spreadsheet theatre.
The question isn't whether to adopt driver-based forecasting. It's whether you can afford to keep budgeting like it's 1995.